Unfolding India’s Consumption Story
The CMS Consumption Report 2024 titled ‘Unfolding India’s Consumption Story’ spotlights the consumption trends & hotspots of India, driven by increased cash based spends.
A part of the 2nd edition of its annual trends compendium, the CMS Consumption Report is underpinned by the proprietary CMS Cash Index™ (CCI) data covering 1,37,000 business points, where every 2nd ATM and every 3rd organized retail outlet in India is serviced by CMS Cash Logistics. CCI was launched in 2016 to track the infusion of cash back into the economy across various commerce points.
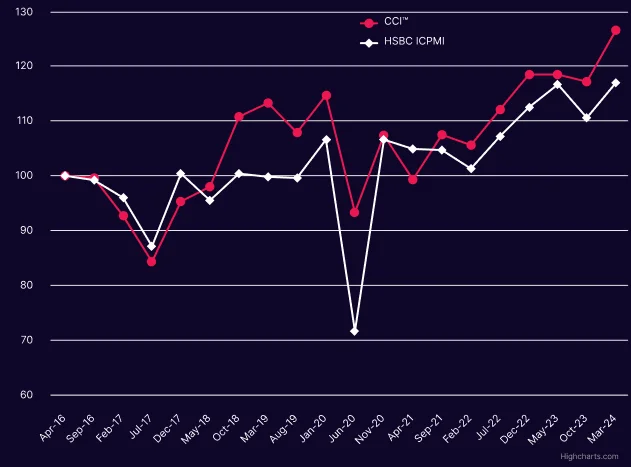
Source: CMS Info Systems & S&P Global.
Note: The HSBC ICPMI readings are rebased to 100 in April 2016, when the CCI™ was launched, to derive the correlations between the two indices.
CMS Cash IndexTM Vs. HSBC India
Composite Purchasing Managers Index
ATM Cash replenishments in metropolitan cities have seen higher growth, followed by SURU.
Average ATM Cash replenishments.
Given the lower penetration of financial and digital literacy in SURU locations, there was a relatively higher dependence on cash. During the second wave of COVID-19 pandemic in April-July 2021, SURU ATMs saw 15.47% growth in average cash replenishment per ATM compared to metro and semi-metro locations.
Top 5 Retail Sectors with
High Growth in Consumption
Source: CMS Info Systems
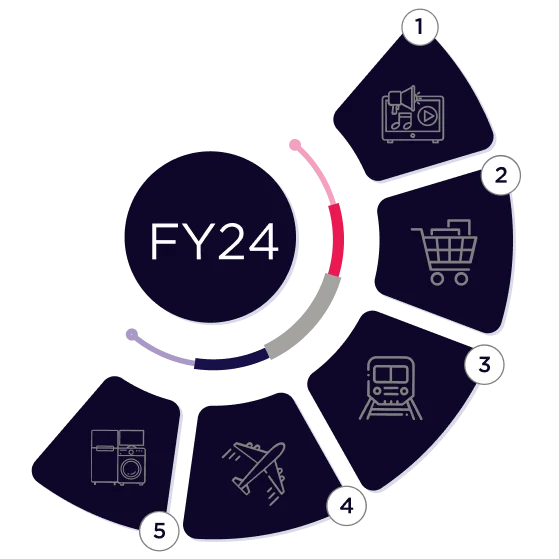
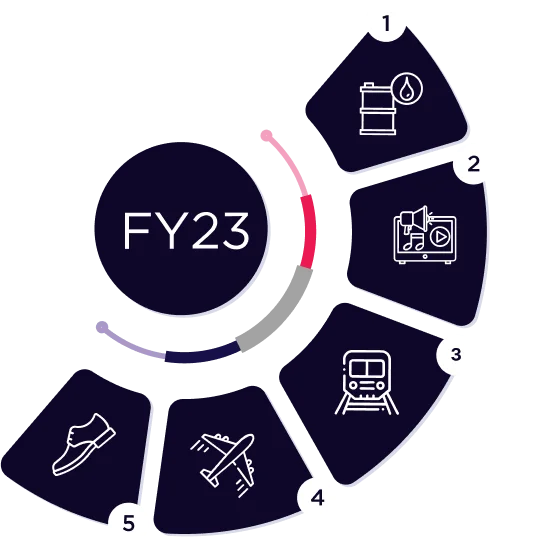
Key Consumption Trends of FY24
FMCG
Annual growth in average spending in FY24
Consumer Durables
Annual growth in average spending in FY24
Indians moving beyond the ‘roti, kapda, makaan’ paradigm.
Easing inflation and rising consumer demand coupled with a narrowing of the urban-rural divide is fuelling growth in FMCG and Consumer Durables.
Aviation
Annual growth in average spending in FY24
Railways
Annual growth in average spending in FY24
Rise of the travel economy
The proliferation of millennials and rising per capita incomes are engendering a travel economy in India with Indians eschewing the consumption of goods in favor of experiences that can range from travel and leisure to fine dining.
E-commerce
Strong recovery in average spending in FY24
Education
Average spending is muted in FY24
Winds of change
In FY24 average spending in e-commerce declined by 14.61%, compared to 25.44% decline in FY23 indicating a strong recovery. In education average spending remained positively muted in FY24, compared to 1.61% decline in FY23, indicating a slight recovery in expenditure.
Media & Entertainment
Annual growth in average spending in FY24
Entertainment is no longer a ‘luxury’
The growth in this sector is being fuelled by increasing spends as Indians allocate a higher portion of their household budgets to M&E, especially post the COVID-19 pandemic.
The Consumption Spillover
Source: CMS Info Systems.
India is a vast country with a diverse population that is split across income, employability, education, and cultural choices. India is also a nation that is currently on the move - per capita incomes are rising, urban, semi-rural, and rural centres are thriving, and consumption is increasing across the country.
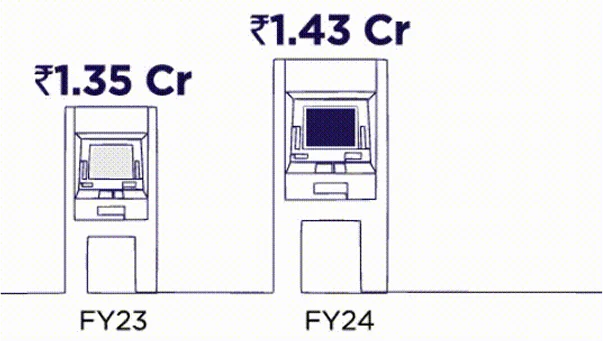
This is evidenced by the 5.51% growth in the monthly average ATM cash withdrawals (used as a proxy for consumption spends) which increased to ₹1.43 crore in FY24 from ₹1.35 crore in FY23.
On a monthly basis, the average ATM cash withdrawals in FY24 were higher compared to FY23 with withdrawals in 10 out of 12 months exceeding the FY23 monthly average of 7.23%.
Consumption is Reaching the Grassroots Even as Metros Continue to Hold Sway
CommensurateCommensurate with FY24 average ATM cash replenishment trend compared to FY22, ATM cash withdrawals in metro locations have grown at 37.49%, whereas SURU witnessed 12.50% growth in ATM cash withdrawals.
Growth in average cash withdrawn in FY24
Metros
10.37%
SURU
3.94%
Semi-metros
3.73%
5 Hotspots of Consumption Spending
- Growth (FY23) (%)
- Growth (FY24) (%)
-

Delhi
#123.78%#122.30% -

Uttar Pradesh
#109.12%#311.45% -

West Bengal
#118.72%#46.94% -

Tamil Nadu
#315.77%#217% -

Karnataka
#218.14%#56.28%
Source: CMS Info Systems.