India’s shifting consumption landscape – a growing footprint
The third edition of the CMS Consumption Report offers a deep dive into the evolving landscape of cash-led consumption trends across India, based on proprietary data from CMS Info Systems (CMS). FY25 has seen a marked rise in consumption, with consumers shifting their spending from experience-led to product-based consumption.
This shift is not just evident in retail category consumption but also in the geographic distribution of spends. Generally, states and Union Territories (UTs) with high Gross State Domestic Product (GSDP) and high per capita GSDP tend to be high spenders. However, within this mix, the consumption hotspots have witnessed rotation over the last couple of years.
A key tailwind for consumption growth in the country is the availability of a robust cash infrastructure. Between 2014-2024, several enablers have aligned to propel the cash economy, which, in turn, has been instrumental in the making of a consumption economy.
GROWTH IN THE PERIOD 2014 - 2024
157%
Currency in Circulation
32%
Number of ATMs
36%
Number of Bank Branches
Peeling the layers of consumption
The Indian household’s consumption habits have evolved significantly with a clear shift towards higher discretionary expenditure, particularly in urban areas where consumers have higher spending power and are more inclined to pay for convenience and comfort.
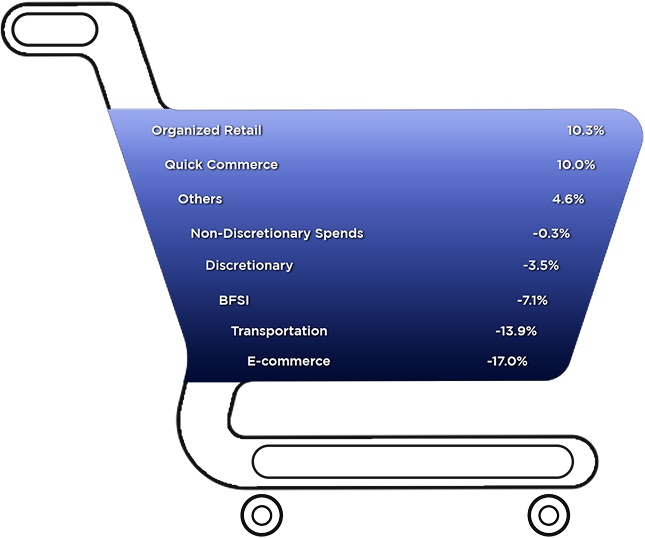
FY25 is witnessing a continuation of this trend with Indian consumers willing to spend more in the Consumer Durables, Multi-brand Outlets, and FMCG sectors as they strike a balance between the experience economy and the goods economy. A notable shift is seen in the growth of Quick Commerce which has witnessed a 10% increase in FY25 and is a new entrant to the consumption basket. When contextualized with the -17% fall witnessed by E-commerce, it indicates an endorsement of a growing trend of quick commerce outpacing traditional e-commerce with its promise of under 30-minute delivery and hyper-localization. The share of E-commerce is further impacted due to 2 key consumption factors – a shift towards organized physical retail and product expansion beyond groceries in the Quick Commerce space.
Key consumption trends of FY25:
-
 Consumer Durables: Long - lasting and steady
This is a significant shift in consumption as it follows a 6% increase in sectoral spending in FY24. In FY23, spending in Consumer Durables witnessed a fall of 6% - this can be attributed to the increased spending towards travel and entertainment in the aftermath of the COVID pandemic and a larger household allocation to discretionary, experience-led household spending.
Average monthly spending in the consumer durables sector increased by
72%
in FY25
*Given the significant churn in the consumer durables sector in FY25, compared to FY24, we are using March 25/March 24 annualized figures to make the numbers more representative.
-
 Multi-brand Outlets : Brick & Mortar make a comeback
Multi-brand Outlets have registered a robust recovery from -29% in FY24, though slightly lower than the 14% growth in FY23.
Growing premiumization, continued need for brick and mortar, especially while purchasing premium products, digital enhancements that offer immersive experiences to consumers, and omnichannel strategies along with rapid delivery systems, ensure consumers enjoy the convenience of online shopping combined with the tactile benefits of physical stores. These factors are acting as tailwinds for the growth in organized and digital retail, with large retail formats. As a result, the Multi-brand Outlet that are housed in these large retail formats are experiencing increased spending.
Average monthly spending in the Multi-brand outlets has increased by
12%
in FY25
-
FMCG: Holistically meeting household needs
While lower than the 17% growth witnessed in FY24, it points to a continued recovery in the sector following a slump of -22% in FY23.
With rising disposable incomes and the basic necessities now taken care of, Indian consumers are showing an increasing preference for discretionary items. More importantly, the growth in FMCG spending, coupled with the growth in Consumer Durables (218%) and Multi-brand Outlets (12%) perhaps points to the making of a secular trend – i.e., continued spending on goods despite a growing interest in the experience economy.
Average monthly spending in the FMCG sector increased by
4%
in FY25
INDIA:
a consumption hub
Growth in monthly average cash dispensed per ATM IN FY25
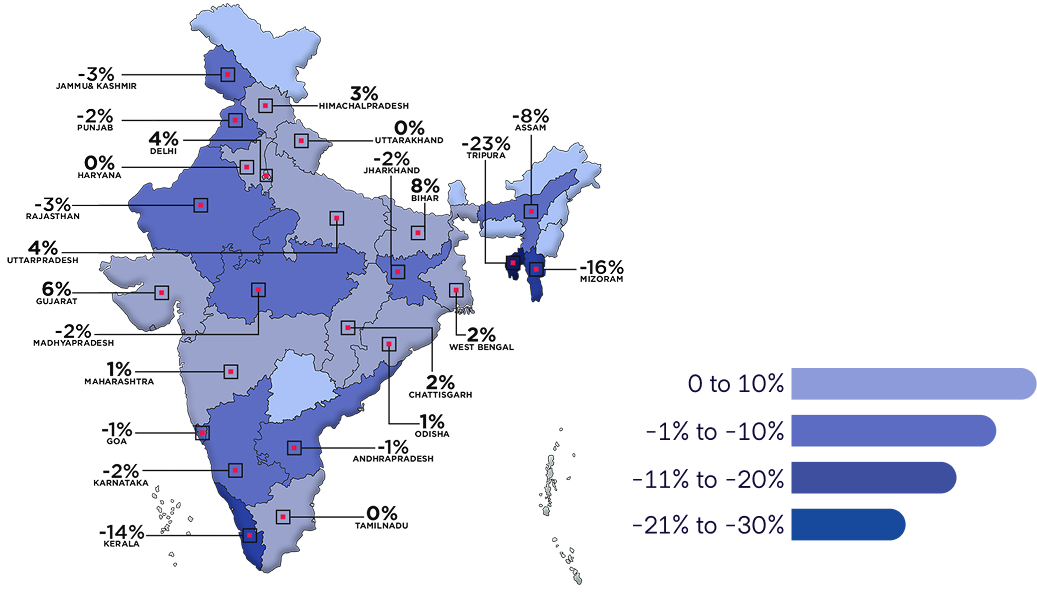
Source: CMS Data
Overall, the average cash dispensed per ATM has increased
from INR 1.02 Cr in FY17 to 1.30 Cr in FY25.
State Picture: Zooming into the states
-
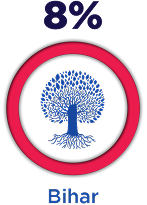
 Top 5 Consumption hotspots in FY25 (YoY Growth)
Similar to sectoral data, we see a rotation theme playing out in state consumption as well with a shift in the top 5 consumption hotspots across years. The only exception has been New Delhi which has consistently stayed in the top 5 for the past 3 consecutive years.


A Tale of 2 Indias
-
India continues to forge ahead on its unique economic growth journey that successfully manages the tenuous balance between being a cash-led economy and a digital economy. Inarguably, India’s digital journey has been significant and swift. However, even as Indians embrace digital payments, cash continues to rule the roost. Cash remains an integral part of the Indian economy and ATMs remain an important touchpoint that facilitate easy access to cash for India’s large and widespread population.
As per CMS ATM Dispensed data, the average ticket size (ATS) of ATM withdrawals in FY25 was INR 5,658, registering a y-o-y growth of 3%. Further, select months like October 2024, January 2025, February 2025, and March 2025 witnessed a higher growth in ticket size at 4%, 4%, 5%, and 6% respectively.
Average ticket size of ATM withdrawals in FY25 was INR 5,658 registering a YoY growth of
3%